
Biostatistics — MCQs

On this page
Consider the following statements about correlation between two variables : 1. The correlation is done between an independent variable X and a dependent variable Y. 2. The coefficient of correlation can range from -1 to ∞. 3. If coefficient of correlation (r) is equal to 1, it indicates there is no association between X and Y. 4. Correlation does not necessarily prove causation. Which of the statements given above are correct ?
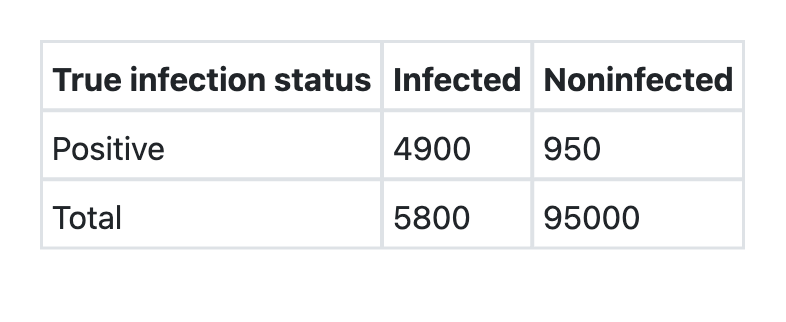
The table below shows the results of ELISA test for HIV infection : Consider the following statements : 1. The sensitivity is 98%. 2. The specificity is 99%. Which of the statements given above is/are correct?
While calculating the ‘total dependency ratio’, which one of the following is used in the denominator?
A researcher has obtained the country-level data on the average Body Mass Index (BMI) and the average sugar intake for 100 countries. Which among the following will be best suited to present the relationship between BMI and sugar intake in the 100 countries?
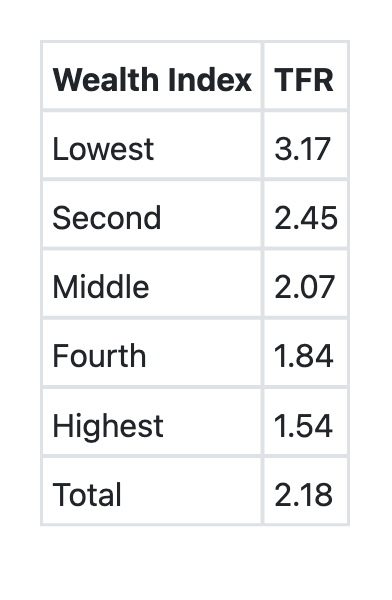
The following table shows the 'Total Fertility Rate (TFR)' by the Wealth Index, as per the National Family Health Survey, (NFHS–4) findings. Which among the following is/are correct about the information?
A town in the hills had a mid-year population of 250000 in the year 2021. During the same year, the death registry of the town recorded 1500 deaths due to tuberculosis in 365 calendar days. Given these facts, what is the specific death rate for tuberculosis in the town?
In a town, a study was carried out to determine the role of cigarette smoking in causation of lung cancer. It was found that a total of 7000 people in the town were smokers. Of them, 70 developed lung cancer. In the same town, 3000 people were non-smokers. Of them, 3 developed lung cancer. Given these numbers, what would be the attributable risk to cigarette smoking for lung cancer?
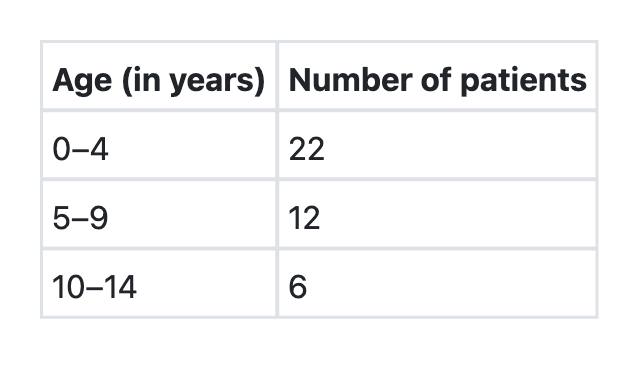
Forty patients with diarrhoeal diseases were studied. Their age distribution is given in the table below : What is the mean age of the patients in this study?
In a normal curve, the area of one standard deviation around the mean includes which of the following per cent of values in a distribution ?
To understand the relationship between weight and height of a group of school children, the data can graphically be best depicted through
Practice by Chapter
Collection and Presentation of Data
Practice Questions
Measures of Central Tendency
Practice Questions
Measures of Dispersion
Practice Questions
Normal Distribution
Practice Questions
Sampling Methods
Practice Questions
Sample Size Calculation
Practice Questions
Hypothesis Testing
Practice Questions
Tests of Significance
Practice Questions
Correlation and Regression
Practice Questions
Survival Analysis
Practice Questions
Multivariate Analysis
Practice Questions
Statistical Software in Research
Practice Questions
Want unlimited practice?
Get full access to all questions, explanations, and performance tracking.
Scan to download app