
Biostatistics — MCQs

On this page
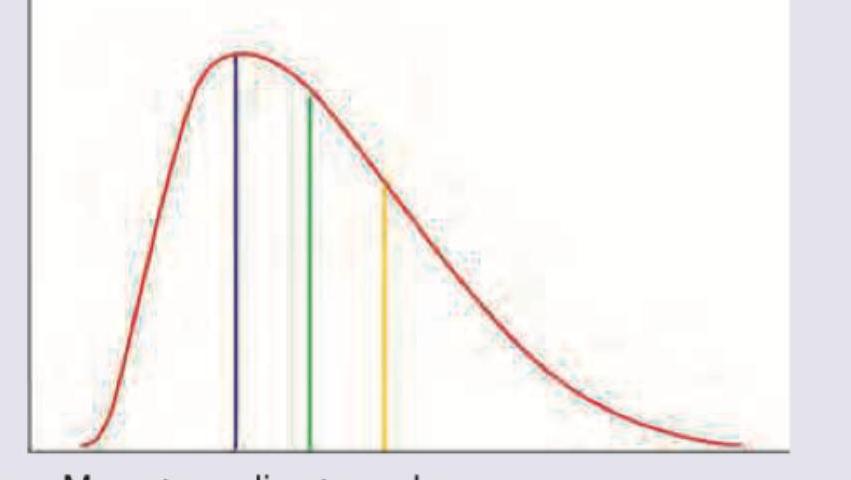
In the following diagram which is correct?
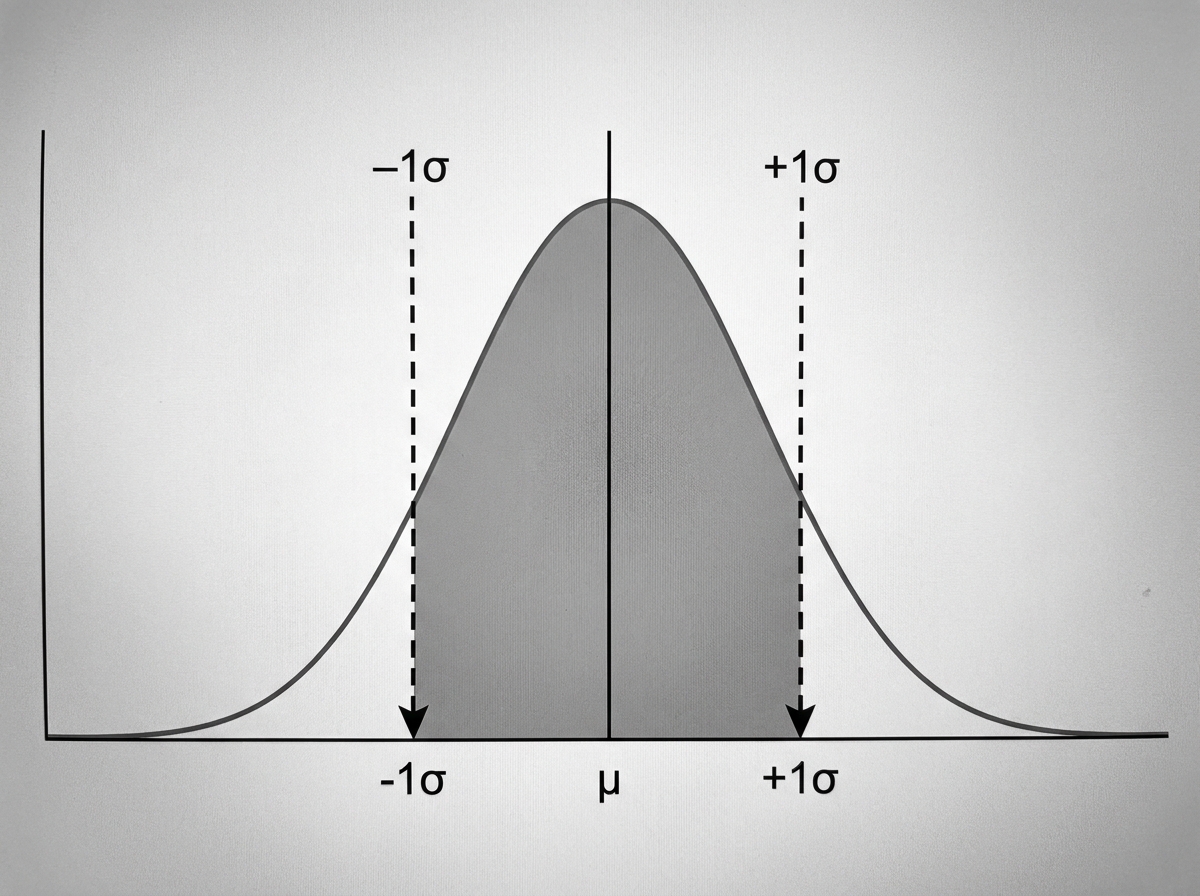
What is the area under the curve between the earmarked points?
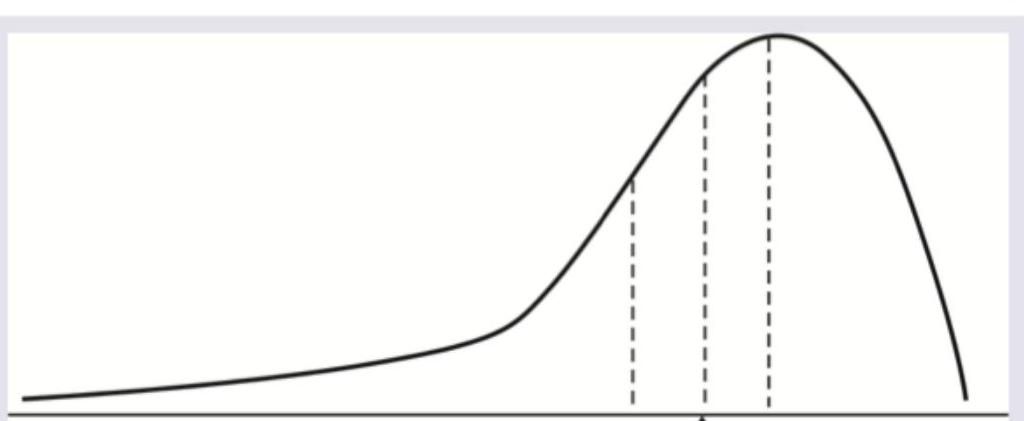
What is correct about the distribution curve shown below?
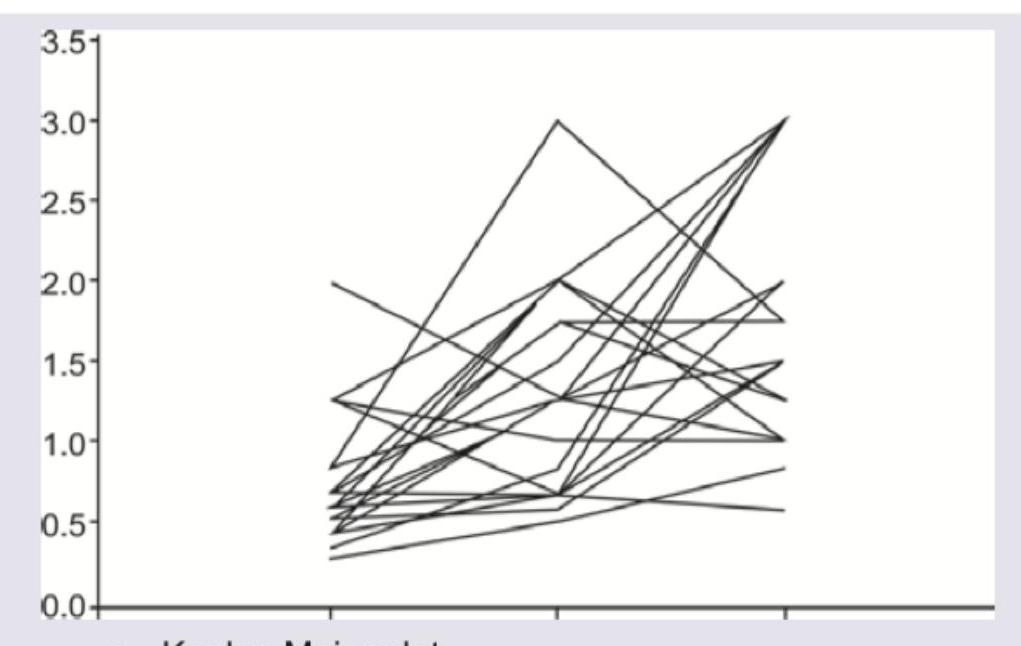
The following plot comparing pharmacokinetics of different ibuprofen brands is called:
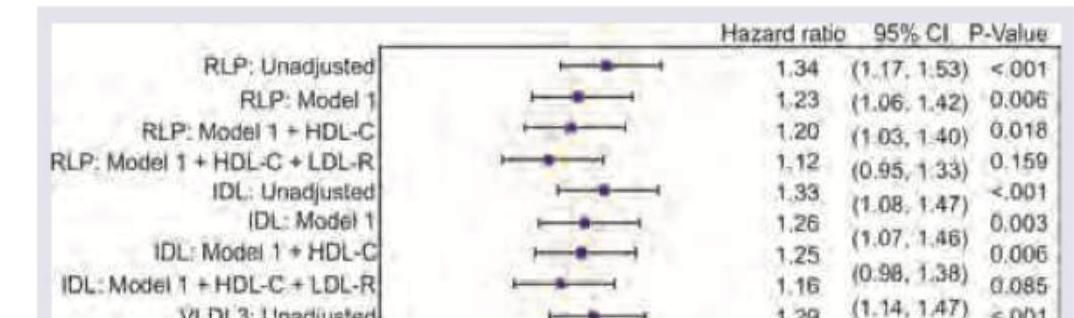
The following statistical diagram is called
The following statistical diagram is called
The following statistical diagram is called
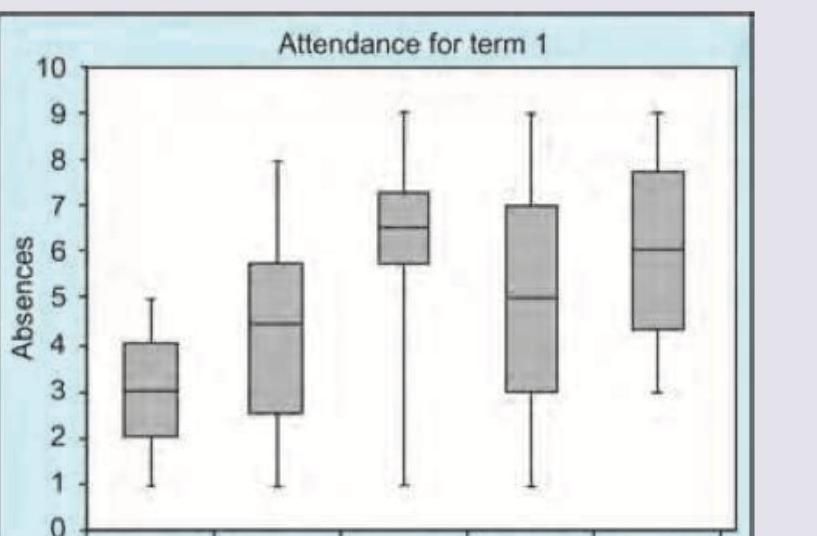
The following statistical diagram is called
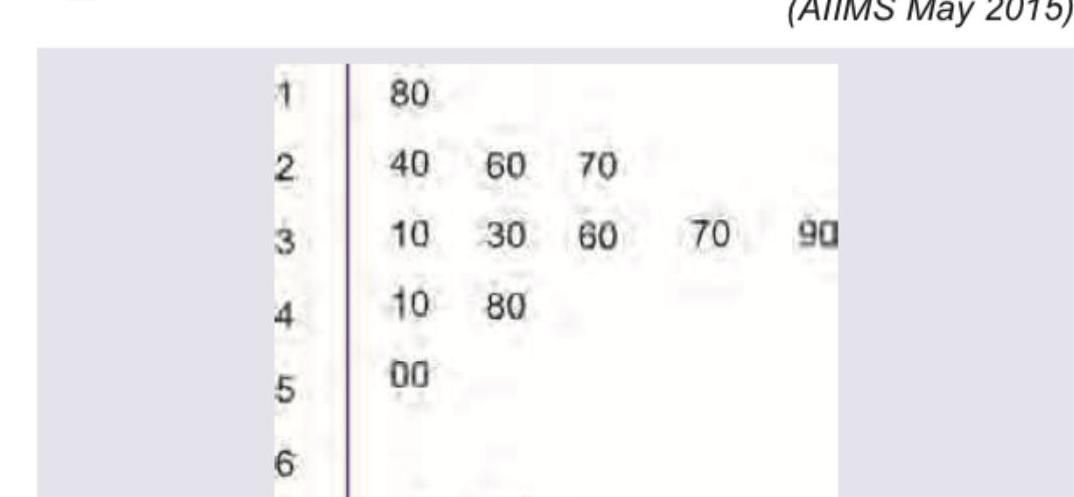
The following statistical diagram is known as
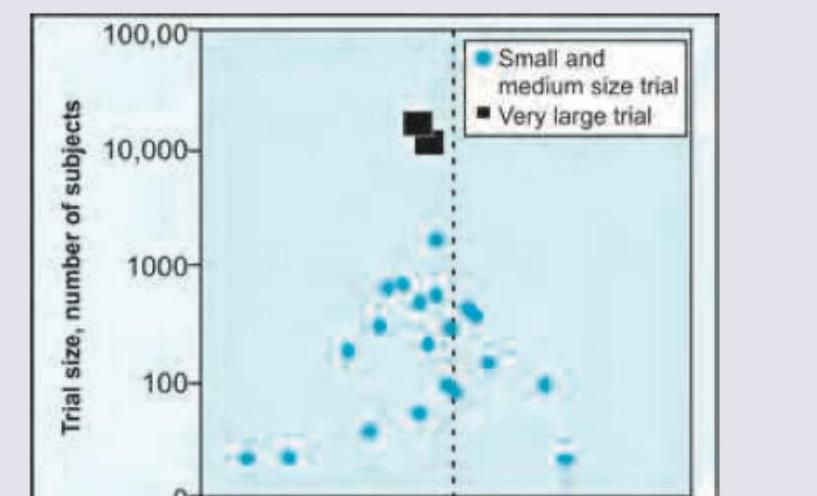
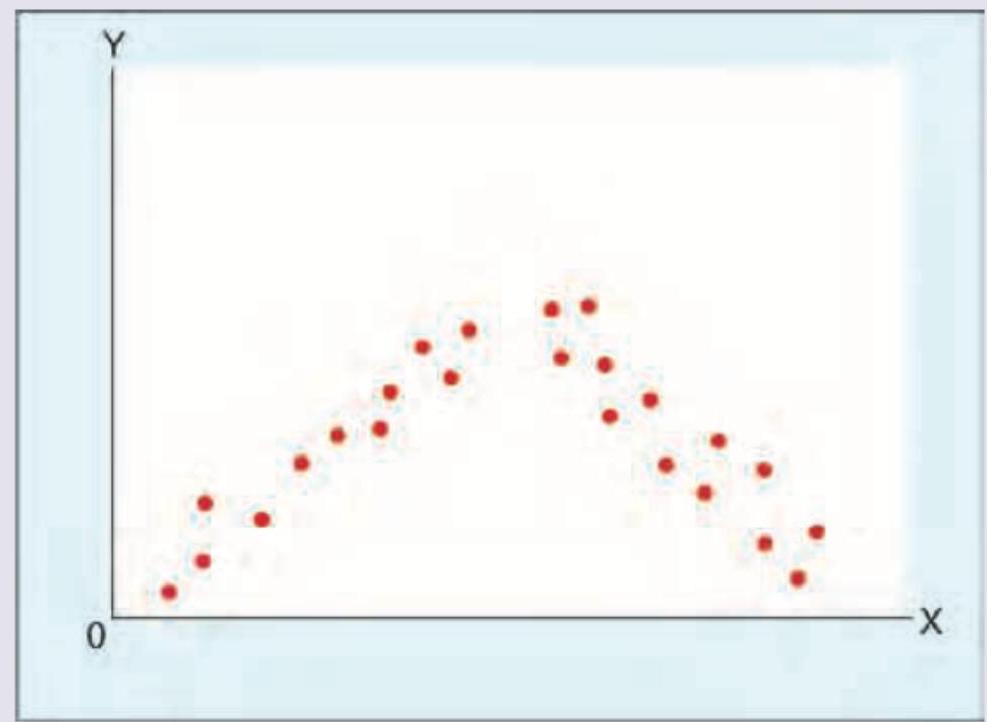
A scatter diagram is shown below between two quantitative variables. Which of the following is the correct interpretation?
Practice by Chapter
Collection and Presentation of Data
Practice Questions
Measures of Central Tendency
Practice Questions
Measures of Dispersion
Practice Questions
Normal Distribution
Practice Questions
Sampling Methods
Practice Questions
Sample Size Calculation
Practice Questions
Hypothesis Testing
Practice Questions
Tests of Significance
Practice Questions
Correlation and Regression
Practice Questions
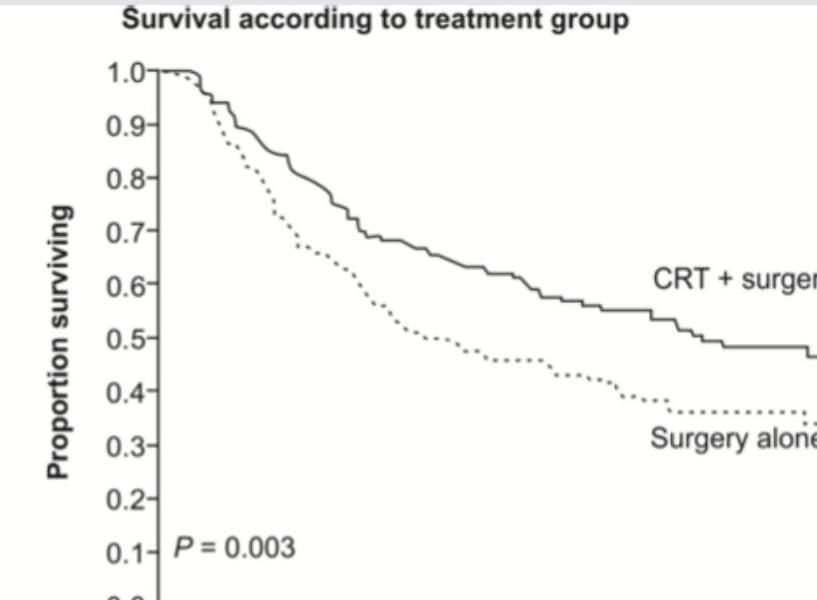
Survival Analysis
Practice Questions
Multivariate Analysis
Practice Questions
Statistical Software in Research
Practice Questions
Want unlimited practice?
Get full access to all questions, explanations, and performance tracking.
Scan to download app